


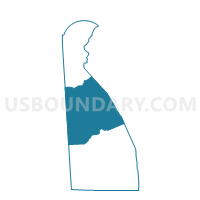
Dover CCD, Kent County, Delaware
About
Outline

Summary
| Unique Area Identifier | 124912 |
| Name | Dover CCD |
| County | Kent County |
| State | Delaware |
| Area (square miles) | 247.93 |
| Land Area (square miles) | 151.94 |
| Water Area (square miles) | 95.99 |
| % of Land Area | 61.28 |
| % of Water Area | 38.72 |
| Latitude of the Internal Point | 39.15885540 |
| Longtitude of the Internal Point | -75.47120400 |
| Total Population | 77,165 |
| Total Housing Units | 31,338 |
| Total Households | 28,934 |
| Median Age | 34.4 |
Maps

Graphs
Select a template below for downloading or customizing gragh for Dover CCD, Kent County, Delaware


Neighbors
Neighoring County Subdivision (by Name) Neighboring County Subdivision on the Map
- District 1, Dixon, Queen Anne's County, MD
- District 1, Henderson, Caroline County, MD
- Central Kent CCD, Kent County, DE
- County subdivisions not defined, Cumberland County, NJ
- Kenton CCD, Kent County, DE
- Milford North CCD, Kent County, DE
- Smyrna CCD, Kent County, DE
Top 10 Neighboring Place (by Population) Neighboring Place on the Map
- Dover city, DE (36,047)
- Camden town, DE (3,464)
- Highland Acres CDP, DE (3,459)
- Dover Base Housing CDP, DE (3,450)
- Rising Sun-Lebanon CDP, DE (3,391)
- Kent Acres CDP, DE (1,890)
- Rodney Village CDP, DE (1,487)
- Cheswold town, DE (1,380)
- Wyoming town, DE (1,313)
- Bowers town, DE (335)
Top 10 Neighboring Unified School District (by Population) Neighboring Unified School District on the Map
- Capital School District, DE (54,739)
- Queen Annes County Public Schools, MD (47,798)
- Caesar Rodney School District, DE (43,649)
- Smyrna School District, DE (33,222)
- Caroline County Public Schools, MD (33,066)
- Milford School District, DE (27,933)
- Lake Forest School District, DE (24,528)
- School District Not Defined (Water), NJ (0)
Top 10 Neighboring State Legislative District Lower Chamber (by Population) Neighboring State Legislative District Lower Chamber on the Map
- State Legislative District 36, MD (137,167)
- State House District 29, DE (27,839)
- State House District 33, DE (24,737)
- State House District 34, DE (23,514)
- State House District 28, DE (22,917)
- State House District 31, DE (20,814)
- State House District 32, DE (20,481)
- State House Districts not defined, NJ (0)
Top 10 Neighboring State Legislative District Upper Chamber (by Population) Neighboring State Legislative District Upper Chamber on the Map
- State Senate District 36, MD (137,167)
- State Senate District 14, DE (59,548)
- State Senate District 15, DE (51,296)
- State Senate District 16, DE (50,103)
- State Senate District 17, DE (47,176)
- State Senate Districts not defined, NJ (0)
Top 10 Neighboring 111th Congressional District (by Population) Neighboring 111th Congressional District on the Map
- Congressional District (at Large), DE (897,934)
- Congressional District 1, MD (744,275)
- Congressional District 2, NJ (692,205)
Top 10 Neighboring Census Tract (by Population) Neighboring Census Tract on the Map
- Census Tract 402.02, Kent County, DE (12,763)
- Census Tract 422.01, Kent County, DE (9,766)
- Census Tract 418.01, Kent County, DE (9,633)
- Census Tract 422.02, Kent County, DE (8,857)
- Census Tract 401, Kent County, DE (6,541)
- Census Tract 433, Kent County, DE (6,131)
- Census Tract 410, Kent County, DE (5,995)
- Census Tract 417.01, Kent County, DE (5,798)
- Census Tract 419, Kent County, DE (5,276)
- Census Tract 418.02, Kent County, DE (5,203)
Top 10 Neighboring 5-Digit ZIP Code Tabulation Area (by Population) Neighboring 5-Digit ZIP Code Tabulation Area on the Map
- 19901, DE (35,055)
- 19904, DE (34,132)
- 19977, DE (22,984)
- 19963, DE (19,206)
- 19934, DE (12,805)
- 19962, DE (10,206)
- 19938, DE (8,357)
- 19946, DE (4,420)
- 19953, DE (4,386)
- 21668, MD (1,904)
Data
Demographic, Population, Households, and Housing Units
** Data sources from census 2010 **
Show Data on Map
Download Full List as CSV
Download Quick Sheet as CSV
| Subject | This Area | Kent County | Delaware | National |
|---|---|---|---|---|
| POPULATION | ||||
| Total Population Map | 77,165 | 162,310 | 897,934 | 308,745,538 |
| POPULATION, HISPANIC OR LATINO ORIGIN | ||||
| Not Hispanic or Latino Map | 72,246 | 152,964 | 824,713 | 258,267,944 |
| Hispanic or Latino Map | 4,919 | 9,346 | 73,221 | 50,477,594 |
| POPULATION, RACE | ||||
| White alone Map | 46,499 | 109,999 | 618,617 | 223,553,265 |
| Black or African American alone Map | 23,129 | 38,913 | 191,814 | 38,929,319 |
| American Indian and Alaska Native alone Map | 622 | 1,043 | 4,181 | 2,932,248 |
| Asian alone Map | 2,147 | 3,306 | 28,549 | 14,674,252 |
| Native Hawaiian and Other Pacific Islander alone Map | 53 | 91 | 400 | 540,013 |
| Some Other Race alone Map | 1,672 | 3,235 | 30,519 | 19,107,368 |
| Two or More Races Map | 3,043 | 5,723 | 23,854 | 9,009,073 |
| POPULATION, SEX | ||||
| Male Map | 36,817 | 78,035 | 434,939 | 151,781,326 |
| Female Map | 40,348 | 84,275 | 462,995 | 156,964,212 |
| POPULATION, AGE (18 YEARS) | ||||
| 18 years and over Map | 58,879 | 121,931 | 692,169 | 234,564,071 |
| Under 18 years | 18,286 | 40,379 | 205,765 | 74,181,467 |
| POPULATION, AGE | ||||
| Under 5 years | 5,374 | 11,150 | 55,886 | 20,201,362 |
| 5 to 9 years | 5,124 | 11,286 | 56,486 | 20,348,657 |
| 10 to 14 years | 4,820 | 11,119 | 56,848 | 20,677,194 |
| 15 to 17 years | 2,968 | 6,824 | 36,545 | 12,954,254 |
| 18 and 19 years | 3,355 | 5,546 | 28,038 | 9,086,089 |
| 20 years | 1,699 | 2,642 | 14,041 | 4,519,129 |
| 21 years | 1,685 | 2,652 | 13,372 | 4,354,294 |
| 22 to 24 years | 4,106 | 6,943 | 35,454 | 12,712,576 |
| 25 to 29 years | 5,587 | 10,494 | 57,603 | 21,101,849 |
| 30 to 34 years | 4,348 | 9,523 | 53,814 | 19,962,099 |
| 35 to 39 years | 4,158 | 9,824 | 55,329 | 20,179,642 |
| 40 to 44 years | 4,505 | 10,746 | 60,758 | 20,890,964 |
| 45 to 49 years | 5,248 | 12,028 | 67,556 | 22,708,591 |
| 50 to 54 years | 4,962 | 11,149 | 65,998 | 22,298,125 |
| 55 to 59 years | 4,274 | 9,428 | 57,816 | 19,664,805 |
| 60 and 61 years | 1,598 | 3,625 | 21,688 | 7,113,727 |
| 62 to 64 years | 2,420 | 5,349 | 31,425 | 9,704,197 |
| 65 and 66 years | 1,368 | 3,059 | 17,571 | 5,319,902 |
| 67 to 69 years | 1,963 | 4,185 | 24,238 | 7,115,361 |
| 70 to 74 years | 2,614 | 5,455 | 30,644 | 9,278,166 |
| 75 to 79 years | 2,193 | 4,214 | 23,885 | 7,317,795 |
| 80 to 84 years | 1,419 | 2,666 | 17,195 | 5,743,327 |
| 85 years and over | 1,377 | 2,403 | 15,744 | 5,493,433 |
| MEDIAN AGE BY SEX | ||||
| Both sexes Map | 34.40 | 36.60 | 38.80 | 37.20 |
| Male Map | 32.10 | 35.00 | 37.40 | 35.80 |
| Female Map | 36.50 | 38.00 | 40.10 | 38.50 |
| HOUSEHOLDS | ||||
| Total Households Map | 28,934 | 60,278 | 342,297 | 116,716,292 |
| HOUSEHOLDS, HOUSEHOLD TYPE | ||||
| Family households: Map | 19,268 | 42,290 | 230,731 | 77,538,296 |
| Husband-wife family Map | 13,303 | 30,221 | 165,280 | 56,510,377 |
| Other family: Map | 5,965 | 12,069 | 65,451 | 21,027,919 |
| Male householder, no wife present Map | 1,405 | 3,093 | 16,989 | 5,777,570 |
| Female householder, no husband present Map | 4,560 | 8,976 | 48,462 | 15,250,349 |
| Nonfamily households: Map | 9,666 | 17,988 | 111,566 | 39,177,996 |
| Householder living alone Map | 7,647 | 14,224 | 87,496 | 31,204,909 |
| Householder not living alone Map | 2,019 | 3,764 | 24,070 | 7,973,087 |
| HOUSEHOLDS, HISPANIC OR LATINO ORIGIN OF HOUSEHOLDER | ||||
| Not Hispanic or Latino householder: Map | 27,598 | 57,870 | 324,134 | 103,254,926 |
| Hispanic or Latino householder: Map | 1,336 | 2,408 | 18,163 | 13,461,366 |
| HOUSEHOLDS, RACE OF HOUSEHOLDER | ||||
| Householder who is White alone | 19,097 | 43,618 | 251,387 | 89,754,352 |
| Householder who is Black or African American alone | 7,856 | 13,302 | 67,757 | 14,129,983 |
| Householder who is American Indian and Alaska Native alone | 247 | 400 | 1,460 | 939,707 |
| Householder who is Asian alone | 659 | 965 | 9,226 | 4,632,164 |
| Householder who is Native Hawaiian and Other Pacific Islander alone | 16 | 24 | 106 | 143,932 |
| Householder who is Some Other Race alone | 463 | 856 | 7,417 | 4,916,427 |
| Householder who is Two or More Races | 596 | 1,113 | 4,944 | 2,199,727 |
| HOUSEHOLDS, HOUSEHOLD TYPE BY HOUSEHOLD SIZE | ||||
| Family households: Map | 19,268 | 42,290 | 230,731 | 77,538,296 |
| 2-person household Map | 8,204 | 17,549 | 98,553 | 31,882,616 |
| 3-person household Map | 4,617 | 10,068 | 54,128 | 17,765,829 |
| 4-person household Map | 3,567 | 8,118 | 44,140 | 15,214,075 |
| 5-person household Map | 1,732 | 3,959 | 20,532 | 7,411,997 |
| 6-person household Map | 702 | 1,586 | 8,022 | 3,026,278 |
| 7-or-more-person household Map | 446 | 1,010 | 5,356 | 2,237,501 |
| Nonfamily households: Map | 9,666 | 17,988 | 111,566 | 39,177,996 |
| 1-person household Map | 7,647 | 14,224 | 87,496 | 31,204,909 |
| 2-person household Map | 1,600 | 3,075 | 18,947 | 6,360,012 |
| 3-person household Map | 263 | 418 | 2,838 | 992,156 |
| 4-person household Map | 103 | 174 | 1,638 | 411,171 |
| 5-person household Map | 32 | 65 | 413 | 126,634 |
| 6-person household Map | 12 | 16 | 142 | 48,421 |
| 7-or-more-person household Map | 9 | 16 | 92 | 34,693 |
| HOUSING UNITS | ||||
| Total Housing Units Map | 31,338 | 65,338 | 405,885 | 131,704,730 |
| HOUSING UNITS, OCCUPANCY STATUS | ||||
| Occupied Map | 28,934 | 60,278 | 342,297 | 116,716,292 |
| Vacant Map | 2,404 | 5,060 | 63,588 | 14,988,438 |
| HOUSING UNITS, OCCUPIED, TENURE | ||||
| Owned with a mortgage or a loan Map | 13,065 | 30,880 | 177,133 | 52,979,430 |
| Owned free and clear Map | 5,487 | 12,166 | 69,591 | 23,006,644 |
| Renter occupied Map | 10,382 | 17,232 | 95,573 | 40,730,218 |
| HOUSING UNITS, VACANT, VACANCY STATUS | ||||
| For rent Map | 909 | 1,572 | 11,399 | 4,137,567 |
| Rented, not occupied Map | 64 | 121 | 676 | 206,825 |
| For sale only Map | 524 | 1,168 | 5,985 | 1,896,796 |
| Sold, not occupied Map | 86 | 223 | 1,011 | 421,032 |
| For seasonal, recreational, or occasional use Map | 166 | 457 | 35,939 | 4,649,298 |
| For migrant workers Map | 5 | 8 | 43 | 24,161 |
| Other vacant Map | 650 | 1,511 | 8,535 | 3,652,759 |
| HOUSING UNITS, OCCUPIED, AVERAGE HOUSEHOLD SIZE BY TENURE | ||||
| Total: Map | 2.54 | 2.62 | 2.55 | 2.58 |
| Owner occupied Map | 2.59 | 2.66 | 2.58 | 2.65 |
| Renter occupied Map | 2.43 | 2.52 | 2.48 | 2.44 |
| HOUSING UNITS, OCCUPIED, TENURE BY RACE OF HOUSEHOLDER | ||||
| Owner occupied: Map | 18,552 | 43,046 | 246,724 | 75,986,074 |
| Householder who is White alone Map | 13,661 | 33,781 | 199,250 | 63,446,275 |
| Householder who is Black or African American alone Map | 3,779 | 7,280 | 35,355 | 6,261,464 |
| Householder who is American Indian and Alaska Native alone Map | 172 | 276 | 901 | 509,588 |
| Householder who is Asian alone Map | 429 | 682 | 5,558 | 2,688,861 |
| Householder who is Native Hawaiian and Other Pacific Islander alone Map | 5 | 9 | 50 | 61,911 |
| Householder who is Some Other Race alone Map | 206 | 386 | 3,025 | 1,975,817 |
| Householder who is Two or More Races Map | 300 | 632 | 2,585 | 1,042,158 |
| Renter occupied: Map | 10,382 | 17,232 | 95,573 | 40,730,218 |
| Householder who is White alone Map | 5,436 | 9,837 | 52,137 | 26,308,077 |
| Householder who is Black or African American alone Map | 4,077 | 6,022 | 32,402 | 7,868,519 |
| Householder who is American Indian and Alaska Native alone Map | 75 | 124 | 559 | 430,119 |
| Householder who is Asian alone Map | 230 | 283 | 3,668 | 1,943,303 |
| Householder who is Native Hawaiian and Other Pacific Islander alone Map | 11 | 15 | 56 | 82,021 |
| Householder who is Some Other Race alone Map | 257 | 470 | 4,392 | 2,940,610 |
| Householder who is Two or More Races Map | 296 | 481 | 2,359 | 1,157,569 |
| HOUSING UNITS, OCCUPIED, TENURE BY HISPANIC OR LATINO ORIGIN OF HOUSEHOLDER | ||||
| Owner occupied: Map | 18,552 | 43,046 | 246,724 | 75,986,074 |
| Not Hispanic or Latino householder Map | 17,952 | 41,819 | 238,348 | 69,617,625 |
| Hispanic or Latino householder Map | 600 | 1,227 | 8,376 | 6,368,449 |
| Renter occupied: Map | 10,382 | 17,232 | 95,573 | 40,730,218 |
| Not Hispanic or Latino householder Map | 9,646 | 16,051 | 85,786 | 33,637,301 |
| Hispanic or Latino householder Map | 736 | 1,181 | 9,787 | 7,092,917 |
| HOUSING UNITS, OCCUPIED, TENURE BY HOUSEHOLD SIZE | ||||
| Owner occupied: Map | 18,552 | 43,046 | 246,724 | 75,986,074 |
| 1-person household Map | 4,062 | 8,592 | 54,526 | 16,453,569 |
| 2-person household Map | 7,013 | 16,099 | 92,249 | 27,618,605 |
| 3-person household Map | 3,147 | 7,520 | 41,471 | 12,517,563 |
| 4-person household Map | 2,444 | 6,153 | 34,389 | 10,998,793 |
| 5-person household Map | 1,146 | 2,887 | 15,197 | 5,057,765 |
| 6-person household Map | 440 | 1,094 | 5,528 | 1,965,796 |
| 7-or-more-person household Map | 300 | 701 | 3,364 | 1,373,983 |
| Renter occupied: Map | 10,382 | 17,232 | 95,573 | 40,730,218 |
| 1-person household Map | 3,585 | 5,632 | 32,970 | 14,751,340 |
| 2-person household Map | 2,791 | 4,525 | 25,251 | 10,624,023 |
| 3-person household Map | 1,733 | 2,966 | 15,495 | 6,240,422 |
| 4-person household Map | 1,226 | 2,139 | 11,389 | 4,626,453 |
| 5-person household Map | 618 | 1,137 | 5,748 | 2,480,866 |
| 6-person household Map | 274 | 508 | 2,636 | 1,108,903 |
| 7-or-more-person household Map | 155 | 325 | 2,084 | 898,211 |
Loading...